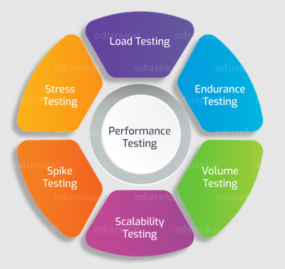
Performance testing is a critical aspect of software development and application management. Ensuring that your application performs well under different load conditions not only improves user experience but also builds confidence in the system’s stability and responsiveness. Apache JMeter, a popular open-source testing tool, enables teams to simulate various scenarios and measure application performance accurately. This guide explains the different types of performance testing you can perform in JMeter, along with practical steps and key metrics to help you optimize your application’s performance.

1. Load Testing in JMeter
Purpose of Load Testing
Load testing helps assess how an application performs under expected traffic and peak load conditions. By simulating concurrent user activity, load testing helps to identify performance bottlenecks and verify that the application can handle typical user loads without issues.
How to Set Up Load Testing in JMeter
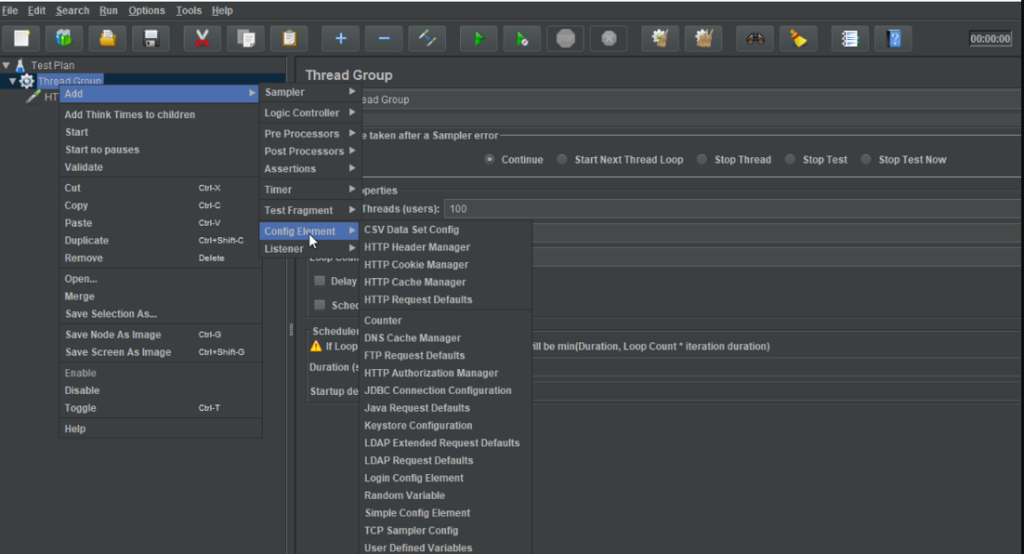
- Create a Thread Group: In JMeter, create a Thread Group to define the number of users (threads), ramp-up period, and loop count. This simulates the load by setting the desired number of concurrent users.
- Add Samplers: Use HTTP Samplers for web applications, JDBC Samplers for database queries, or other relevant samplers based on the application’s protocol.
- Add Listeners: Add listeners like Summary Report, Aggregate Report, and View Results Tree to track performance metrics during the test.
Metrics to Monitor
- Response Time: Measures how quickly the server responds to requests, crucial for user satisfaction.
- Throughput: Indicates the number of requests handled per second, which helps gauge the server’s capacity.
- Error Rate: Tracks the percentage of failed requests, which may indicate load handling issues.
2. Stress Testing in JMeter
Purpose of Stress Testing
Stress testing involves pushing the application beyond its normal operational limits to determine its breaking point. This type of testing helps to identify how the application performs under extreme loads and how it fails when resources are exhausted.
Steps for Stress Testing in JMeter
- Increase Load Beyond Peak: Set up a Thread Group with more users than the application is expected to handle, and gradually increase the load.
- Monitor Responses: Observe how the system responds as it approaches its breaking point. Look for errors, performance degradation, or application crashes.
Key Metrics to Track
- Response Time Under Extreme Load: Helps understand how long users will have to wait under high load.
- Error Rates: Tracks the increase in errors as the application reaches its capacity.
- Resource Utilization: Monitors CPU, memory, and disk usage to identify bottlenecks
3. Spike Testing in JMeter
Purpose of Spike Testing
Spike testing evaluates how an application handles sudden increases and decreases in load, such as those caused by flash sales or breaking news. This type of test helps ensure that the application can handle unexpected load spikes and recover smoothly.
Setting Up Spike Testing in JMeter
- Set Up a Rapid Ramp-Up: Configure a Thread Group with a sudden ramp-up to simulate a spike in users, followed by an immediate ramp-down.
- Track Recovery: Observe how the application behaves during the spike and whether it recovers gracefully afterward.
Important Metrics
- Response Time During Spike: Shows if the application remains responsive under sudden load.
- Error Rate: Tracks application stability by monitoring for failures during the spike.
- Recovery Time: Measures how quickly the application returns to normal performance after the load spike.
4. Endurance (Soak) Testing in JMeter
Purpose of Endurance Testing
Endurance, or soak testing, checks the system’s performance over an extended period to detect issues like memory leaks and performance degradation. By running a test for several hours or days, endurance testing helps identify problems that short tests might miss.
Steps for Endurance Testing in JMeter
- Set Up Long-Running Thread Group: Create a Thread Group to maintain a consistent load level over a prolonged period (hours or days).
- Track System Metrics Over Time: Monitor metrics like memory usage and response time to identify signs of performance degradation.
Metrics to Monitor
- Memory and CPU Usage: Looks for signs of resource leaks or depletion.
- Response Time Consistency: Ensures that the application maintains consistent performance.
- Throughput Stability: Verifies that the application can handle requests effectively over time.
5. Scalability Testing in JMeter
Purpose of Scalability Testing
Scalability testing evaluates whether an application can handle increased load by scaling resources up or down. This test helps ensure that the system can grow or shrink to accommodate varying user demands effectively.
Configuring Scalability Testing in JMeter
- Increase Load in Stages: Gradually increase the number of threads (virtual users) in the Thread Group to simulate increased load.
- Monitor Resource Usage: Watch CPU, memory, and network usage to determine if the application scales efficiently with the load.
Key Metrics for Scalability Testing
- Response Times at Different Loads: Measures how response times change as the load increases.
- Error Rate: Tracks error rates at various load levels.
- Resource Utilization: Monitors the effectiveness of resource scaling.
6. Volume Testing in JMeter
Purpose of Volume Testing
Volume testing assesses the application’s ability to handle a large amount of data. This type of testing is particularly useful for applications that process significant volumes of information, such as databases or file processing systems.
How to Conduct Volume Testing in JMeter
- Simulate High Data Volume: Configure the test to send large data volumes, such as batch records or files, to the system.
- Monitor Data Handling Performance: Track response times and server performance to ensure the system handles the data load effectively.
Metrics to Monitor
- Data Processing Speed: Measures how quickly the system processes large data sets.
- Response Time: Observes if response times remain acceptable under high data loads.
- Memory Usage: Checks if the application handles high data volumes without resource exhaustion.
7. Configuration Testing in JMeter
Purpose of Configuration Testing
Configuration testing evaluates how the application performs under different hardware, software, or network configurations. This test helps identify the optimal setup for the best performance.
Setting Up Configuration Tests in JMeter

- Test on Different Setups: Run tests under varying configurations, such as different server hardware, operating systems, or network speeds.
- Compare Performance Metrics: Track performance across configurations to identify the best setup for your application.
Key Metrics to Track
- Response Time and Throughput: Compares these metrics across different configurations to find the optimal setup.
- Error Rates: Identifies configuration setups that may be prone to errors.
- Resource Utilization: Helps determine the configuration that makes the best use of resources.
Conclusion
Each type of performance testing in JMeter serves a specific purpose, helping developers and testers ensure that applications are robust, scalable, and user-friendly. By conducting load, stress, spike, endurance, scalability, volume, and configuration testing, you gain a comprehensive understanding of your application’s performance and identify areas that need improvement. Implementing these tests in JMeter allows you to optimize the application for real-world conditions, enhance user satisfaction, and ensure reliability in production environments.